Dappnode Monitoring Service (DMS)
As a Dappnode user, there are times when having insights into the performance of your packages or your whole system can be incredibly beneficial. This means understanding the condition or "health" of your packages, the utilization of your computer resources such as CPU, RAM, and disk space, as well as monitoring network traffic flow. Yet, managing all of these aspects can become complex and tedious, even for those with experience. This is precisely where the Dappnode Monitoring Service (DMS) steps in to simplify matters.
How It All Works
DMS acts as a strong monitoring solution, simplifying the complex task of monitoring your packages and system by automatically collecting all available data and visualizing it for you. But how does it achieve this? DMS primarily comprises two key components: Prometheus and Grafana. Let's break it down.
-
Prometheus Integration: DMS seamlessly incorporates Prometheus, a comprehensive monitoring toolkit. Prometheus is responsible for gathering all data coming from other Dappnode packages. This information is the foundation for understanding your package's performance.
-
Grafana Dashboards: To transform raw data coming from Prometheus into meaningful insights, DMS brings in Grafana, renowned for its exceptional data visualization capabilities. Through customizable dashboards, you gain instant access to both real-time and historical perspectives on how your packages are functioning.
Your Privacy Matters:
At Dappnode, we respect your privacy. Rest assured that all the metrics collected by DMS are stored locally, ensuring your information remains private and secure.
Installing and accessing DMS
Locate DMS in your DAppStore, listed among the Featured packages. The installation process is straightforward, much like any other Dappnode package. After installation, you can access DMS Grafana and explore all its dashboards by visiting http://dms.dappnode.
Monitoring through Dashboards
As explained in the official Grafana documentation, Grafana simplifies data visualization through organized views known as dashboards. In the context of Dappnode, many packages, especially our staker packages, come equipped with pre-built Grafana dashboards that seamlessly integrate into DMS upon installation. These dashboards are designed to provide specific insights into the performance of the corresponding packages. To explore the range of available Grafana dashboards within DMS, follow these simple steps:
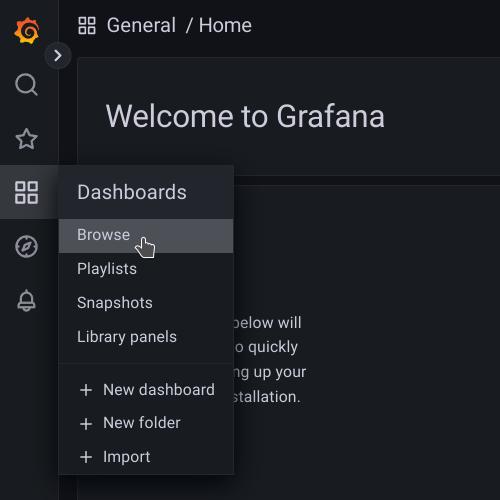
- Accessing Dashboards: Find the "Dashboards" icon on the left-hand side of the DMS interface and hover your mouse over it. Click on "Browse" to proceed.
-
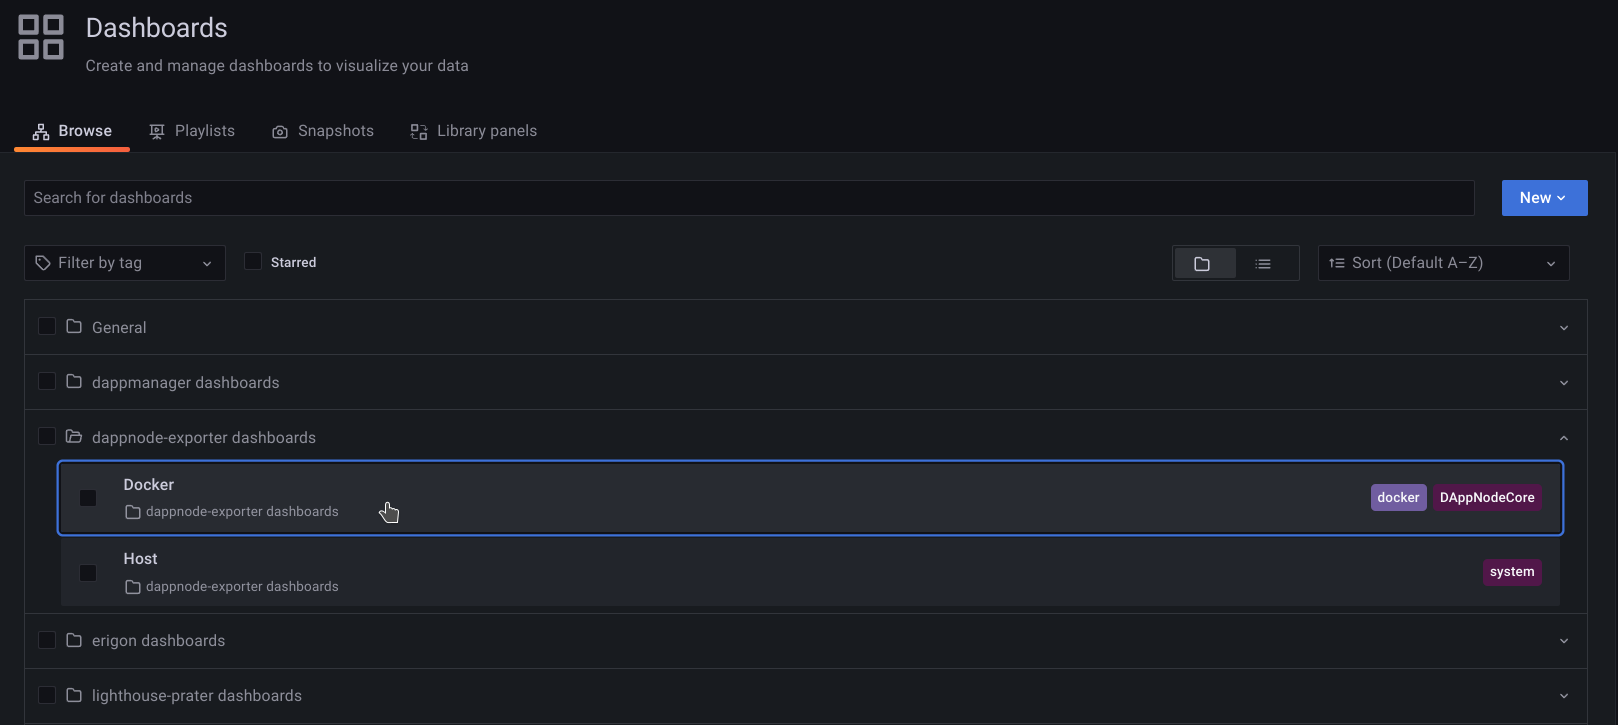
Dashboard Folders: In the dashboard browsing view, you'll see different dashboard folders. Each folder contains one or more dashboards related to specific aspects of your Dappnode environment. For instance, let's click on the "Docker" dashboard provided by the Dappnode Exporter package.
-
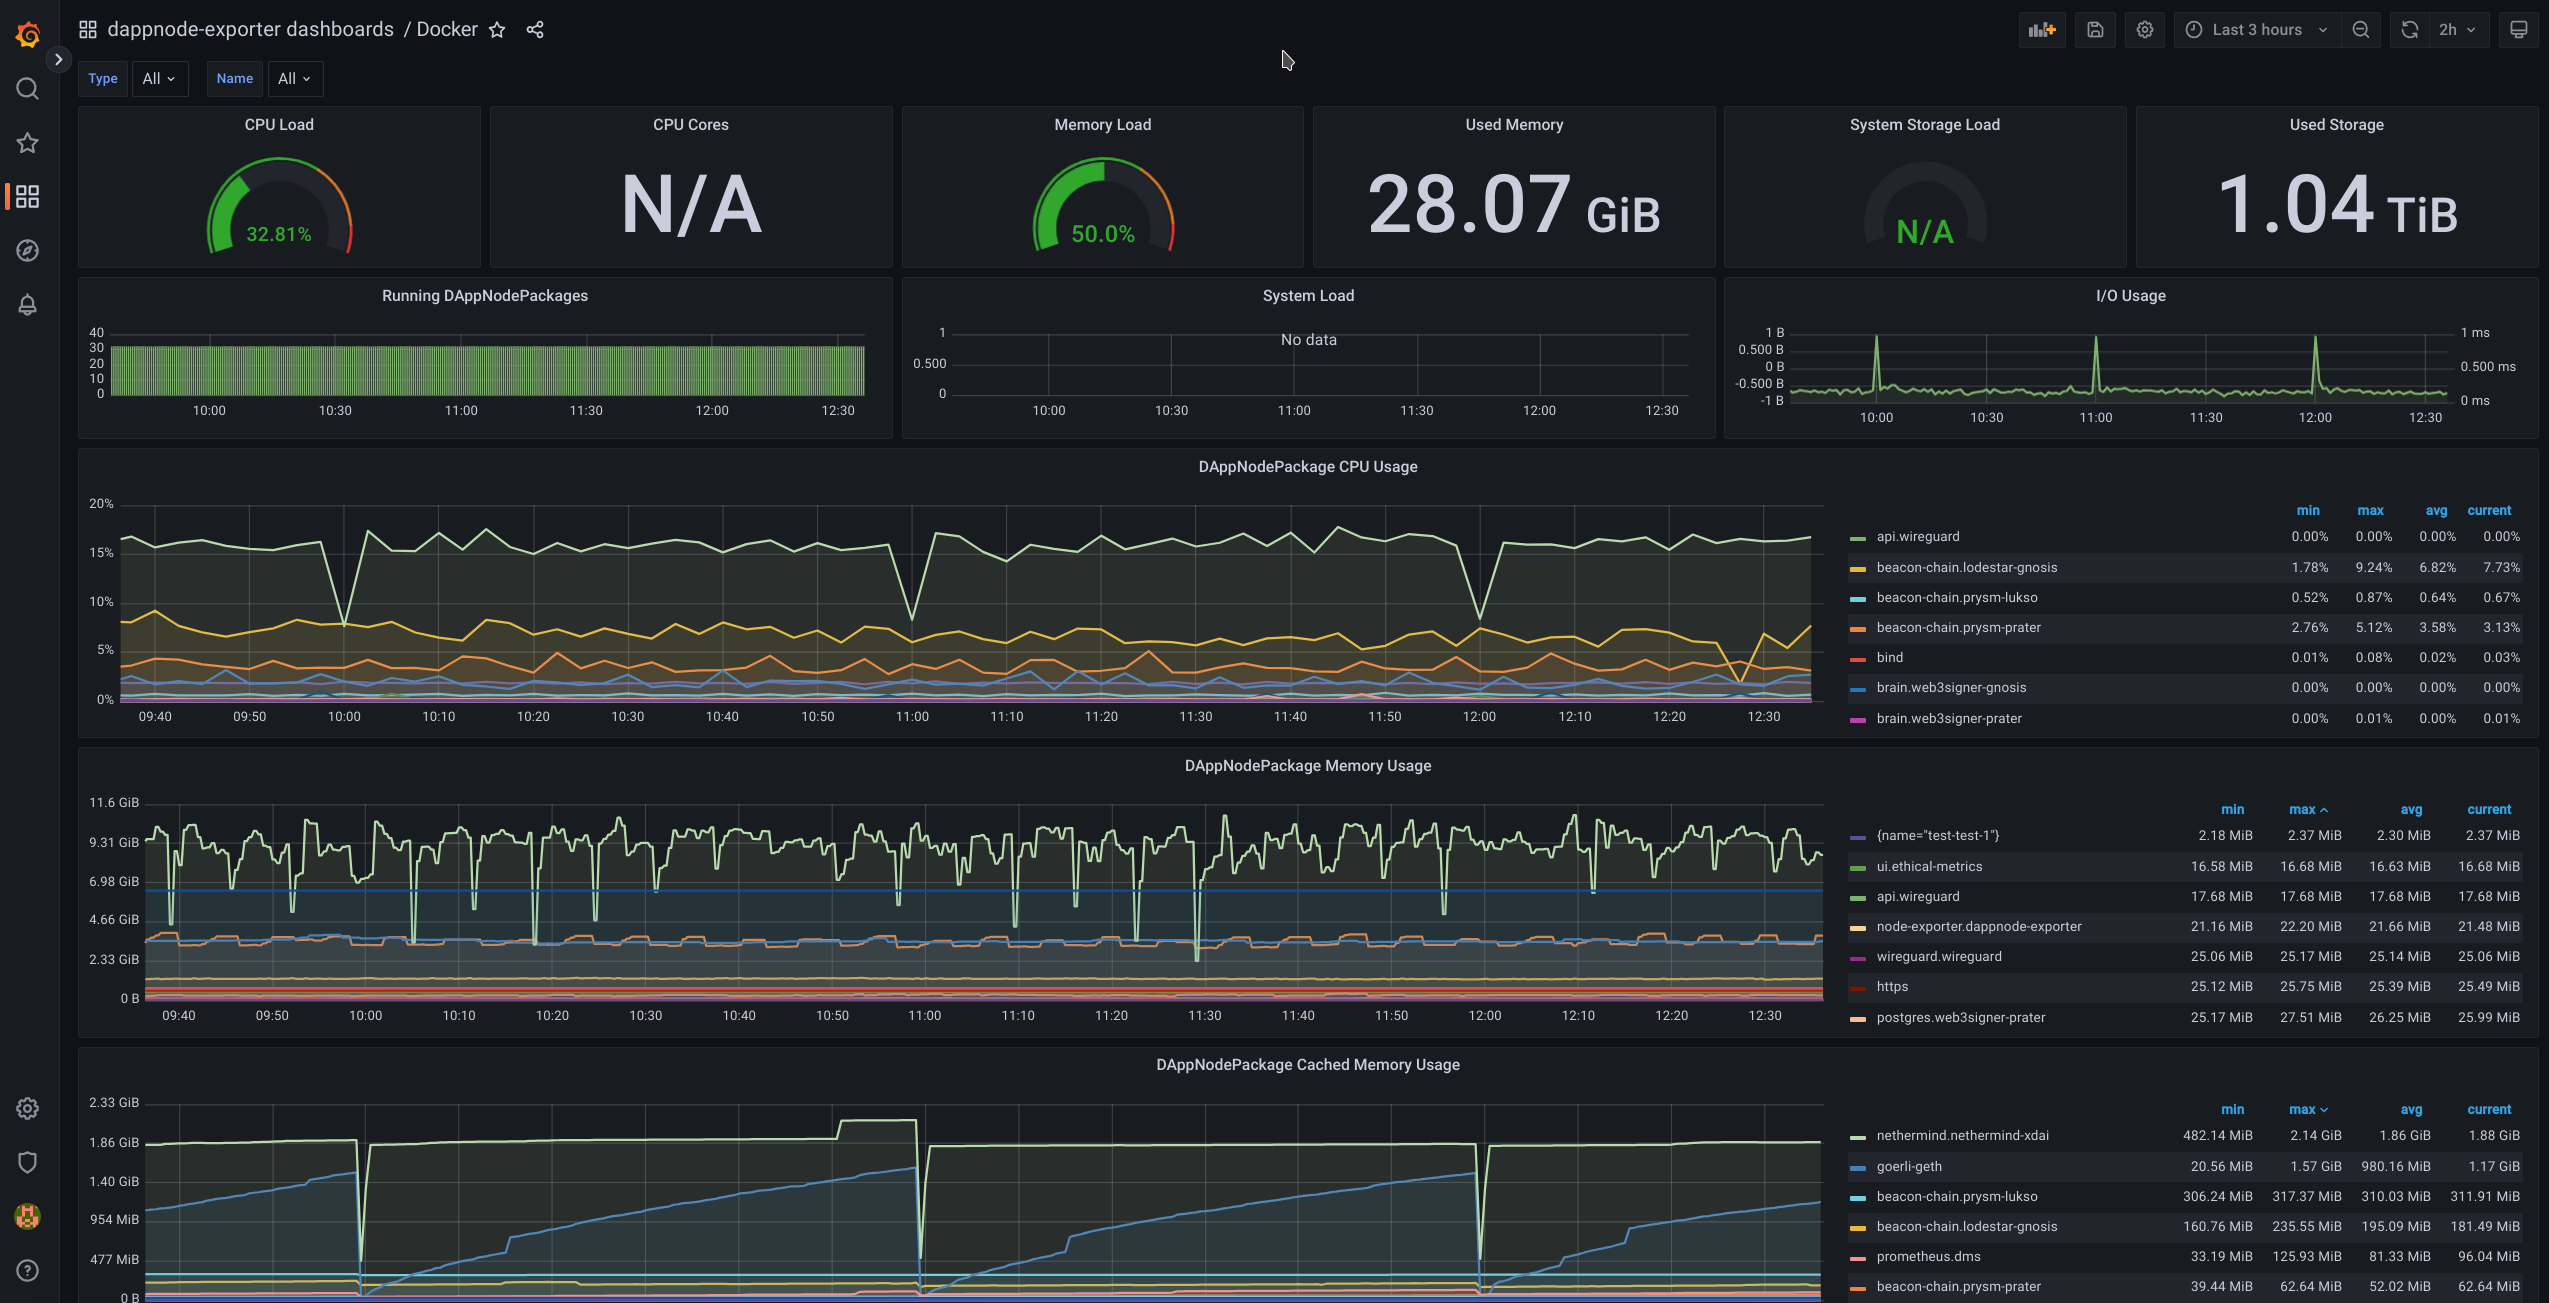
Exploring a Dashboard: That's it! You are now within the chosen dashboard, such as the "Docker" dashboard. Here, you'll find valuable information about all your installed packages, including relevant metrics and performance indicators.
As you navigate through these Grafana dashboards, it's worth mentioning that the official Grafana documentation provides a wealth of information about dashboards, visualization techniques, and best practices. Exploring this documentation can greatly enhance your ability to interpret and utilize the data presented in DMS dashboards. Whether you're new to Grafana or seeking advanced tips, the official documentation is a valuable resource for maximizing your monitoring experience.
💡 If you're looking for specific dashboards beyond what comes pre-installed, Grafana's dashboard repository makes it easy to search and import dashboards created by the community.
Feel free to check out the different dashboard folders and adjust how things look based on what you like. Grafana offers a bunch of cool features, so have fun exploring and making the dashboards work just right for you!