Validator performance monitoring
The Performance tab allows you to monitor the performance of your Lido validators associated with your Node Operator.
Understanding Lido CSM Reports
Before diving into the details, it's essential to understand what a Lido CSM report is. These reports contain performance data for all validators in the CSM and are distributed via IPFS hashes by the Lido team.
- On Mainnet, reports are distributed every 28 days.
- On Hoodi, reports are distributed every 7 days.
Lido Report Cards
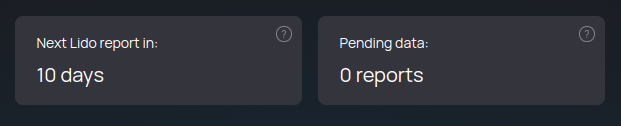
At the top of the Performance tab, you'll find two key information cards:
-
Next Lido Report: Displays the time remaining until the next report is distributed by the Lido CSM team.
-
Pending Data: As mentioned earlier, reports are distributed by the Lido team via IPFS. The Lido CSM package backend scans for these IPFS hashes and attempts to resolve their content to process the report data.
-
This card shows the number of reports left to be processed by the backend. If
reports > 0, the data in the table and chart below is not fully updated, and some reports are missing. -
The backend processes pending hashes every 3 hours. If
reports > 0for an extended period, the IPFS gateway may not be able to find the remaining hashes.tipTo resolve this issue, navigate to the Config tab of the Lido CSM package and change the
IPFS_URLto another gateway that may successfully locate the hashes.
-
Range Selector

The Range Selector controls all the data displayed in the Performance tab. It acts as a filter for the chart and table below.
Available Ranges:
-
Last month
-
Last year
-
Ever (From the first report that included a validator associated with your Node Operator)
infoOn Hoodi, an additional week range is available since reports are distributed weekly.
Node Operator Efficiency vs. Lido Average Efficiency
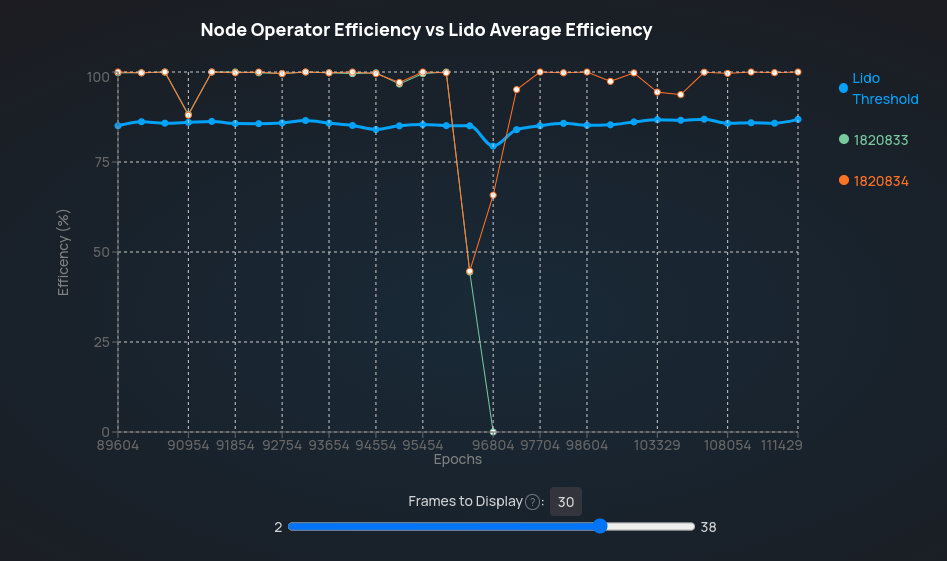
This chart compares the efficiency of your validators with the Lido threshold for the selected range.
-
Includes a slider to adjust the number of frames displayed.
infoA frame represents the period between Lido CSM reports
-
Allows toggling validator visibility by clicking on the validator index in the legend next to the chart.
Summary Table
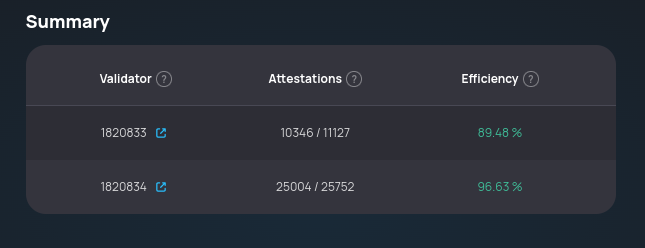
This table provides an overview of the attestations assigned and included for each validator within the selected range.
Efficiency Calculation:
-
The efficiency column is based on your validator's attestation rate.
-
If
attestation rate for selected range > Lido average threshold for selected range, the efficiency is displayed in green. Otherwise, it appears in red.cautionEven if efficiency is red, you may still receive rewards for the current report, and vice versa, since this data is based on past reports and can fluctuate significantly between frames.